Pairs trading is a neutral strategy that is based on finding price correlation between a pair of financial assets. Pairs trade allows not only to diversify assets, but also to conduct parallel trading of two or more assets that go in contrast. strategy can be applied both on stock and commodity markets, as well as on currency and cryptocurrency markets.
For first time, pairs trade was used in middle of last century. But until recently, it remained a relative “secret” of professionals and was finally revealed to general public only with advent of Internet era.
Some attribute idea of origin of strategy to mathematicians on Wall Street who worked for Morgan Stanley & Co. Programmers Jerry Bamberger, David Shaw and trader Nunzio Tartaglia studied automatic trading based on pairs trade and developed their own system, which brought in $ 50 million for first year of operation in 1987. But in following years, their system brought a loss.
The essence of pairs trade
Pairs trade is based on related assets that have same dependencies or basis, for example, price of oil and value of shares of oil companies. If quotations for a particular commodity fall, value of shares tied to them may fall disproportionately, that is, if price of oil falls, for some reason, shares of oil companies may grow in short term. It is on such phenomena that strategy of pairs trade is based.
The main risk is that correlation may not recover. In other cases, trader remains with a profit or at least closes positions in break-even zone.
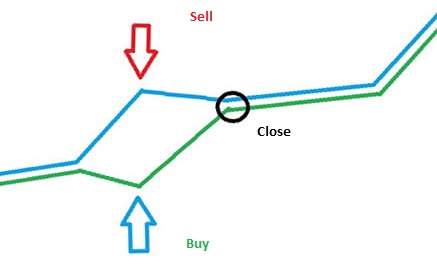
Having two correlated assets, player opens a short position on one of them, and a long position on second. Thanks to this approach, even in case of extremely unfavorable market conditions, trader minimizes losses over a long distance with profits over short periods and vice versa. As already mentioned, pairs trade requires a stable price correlation between two assets. In case of stock and commodity markets, it usually occurs between shares of companies operating in same industry, but this is not a prerequisite.
The moment of violation of such a relationship is called spread divergence.
The correlation can be direct and inverse. In first case, price of one asset literally repeats all price movements of other. With inverse correlations, graphs look mirrored.
How to find correlating stocks
This can be done both with help of fundamental and technical analysis. latter is somewhat simpler. Here it is enough to study history of fluctuations of several assets in order to identify their similarity.
In order to simplify your task, it is advisable to look for securities in same industry. First of all, it is recommended to pay attention to indexes. For example, S&P 500 and Dow Jones Utilities Average correlate quite well with each other. Accordingly, shares of all companies that will be included in these indices will also correlate to some extent.
How to work with a couple
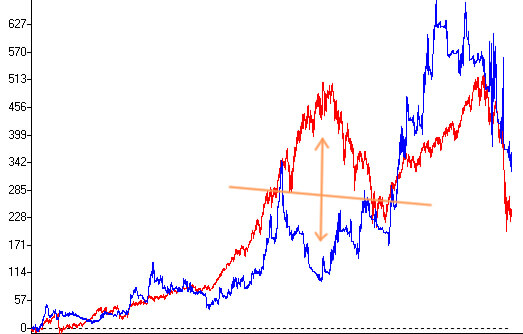
Here is a pair of GM and FORD. These are shares of American auto manufacturers, and they often correlate with each other. On chart, you can see curve of ratio of value of shares of Ford and General Motors for week.
We are interested in position of this curve in relation to deviation lines. In particular, white straight line that is in middle means average ratio. Yellow and red are first and second standard deviations.
In order to use pairs trade, it is necessary to wait for moment when curve reaches first or second deviation. In this situation, it can be assumed that in near future, shares will begin to approach each other in price to achieve a balance (white line).
As for transaction volume, it should be in ratio of 5% in one share and 5% in another. Naturally, there are certain risks in such trading. Therefore, it is necessary to determine size of Stop Lose.
That’s exactly what such a unique analytical tool as My Pairs Trade was created for. Which allows you not to spend a huge amount of time searching and tedious data collection from different sites and platforms for analyzing indicators. It is enough to enter all necessary data that you are interested in. And you will be provided with a squeeze with all necessary indicators from more than 1,326,380 co-integrated pairs of promotion. Which will allow you to quickly make decisions and find pairs of assets that could have been missed in usual analysis.
At same time, it is important to remember that this method of trading is by no means some kind of miracle tool that helps to always make a profit. No matter how carefully asset pairs are selected, relationship between them can break off at any time. circumstances that caused Spread to stop converging can be very different and even incredible, so it is unrealistic to calculate them to end. It is necessary not only to be fully aware of all possible risks, but also to have a clear plan of action for various scenarios of development of events.
Secure your strategy in pairs trade with My Pairs Trade