
Financial transactions are accompanied by high risks. That is why professional traders have always been looking for a way to minimize the risk. One of the strategies aimed at risk diversification is pair trading. This type of trading is a kind of classical arbitrage – statistical arbitrage. The strategy is based on the use of statistical dependencies between various trading instruments and the formation of a market neutral portfolio. The idea of “market neutral” trading itself means that the profit in the transaction does not directly depend on the movement of a single instrument. In pair trading, spread of the pair is traded – do not confuse with Bid/Ask spread, but more on this later.
Tool selection for pair trading
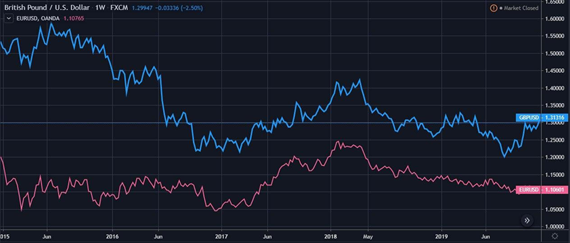
In pair trading, positions are opened simultaneously on two instruments – currency pairs, cryptocurrencies, shares, futures and others. The main selection criterion is the presence of a correlation between active assets. The correlation can be direct or reverse (positive or negative). In case of direct correlation, the instruments move in the same direction, practically copying each other. Such an example can be the currency pairs EURUSD-GBPUSD, or AUDUSD – XAUUSD, or oil futures and shares of oil refining corporations and many other variants of direct interdependence.
Correlation of stock active assets is a ratio between the price movements of two shares from one economy sector or shares with other active assets classes, such as bonds, indices, futures, options, investment funds. Active assets should always belong to the same economy sector. Correlation dependence of two shares is studied and calculated based on the data of a significant period of time, measured by many months or years. Interrelation between two stock active assets is measured by Pearson correlation coefficient. When calculating this indicator, the average statistical deviations from the average values of spread are taken into account. Indicator values range from one to minus one (+100% -100%). When indicator values are higher than 0.7 (70%), the correlation of active assets is pronounced. The interval from 0.4 to 0.7 characterizes the average dependence. The values less than of 0.4 are weak correlation. The negative range of values shows reverse dependence. Identifying the correlation between sock active assets allows you to use this data in trading. Diversification is a risk management strategy. The formation of an investment portfolio, with the inclusion of shares with a high level of correlation, allows you to diversify the portfolio.
Correlation of stock active assets is a ratio between the price movements of two shares from one economy sector or shares with other active assets classes, such as bonds, indices, futures, options, investment funds. Active assets should always belong to the same economy sector. Correlation dependence of two shares is studied and calculated based on the data of a significant period of time, measured by many months or years. Interrelation between two stock active assets is measured by Pearson correlation coefficient. When calculating this indicator, the average statistical deviations from the average values of spread are taken into account. Indicator values range from one to minus one (+100% -100%). When indicator values are higher than 0.7 (70%), the correlation of active assets is pronounced. The interval from 0.4 to 0.7 characterizes the average dependence. The values less than of 0.4 are weak correlation. The negative range of values shows reverse dependence. Identifying the correlation between sock active assets allows you to use this data in trading. Diversification is a risk management strategy. The formation of an investment portfolio, with the inclusion of shares with a high level of correlation, allows you to diversify the portfolio.
In case of changes in market situation, change in the monetary policy of the Central Bank (CB) or other events that affect the exchange rate of the national currency or market activity, the investor can change the ratio between shares and bonds. Instability at the markets leads to the flow of capital from high-risk active assets to less risky ones, then the volume of bonds in the portfolio increases, and the volume of shares decreases. By tracking the dynamics of mutual interrelation between various instruments, you can quickly adjust the investment portfolio and change trading tactics.
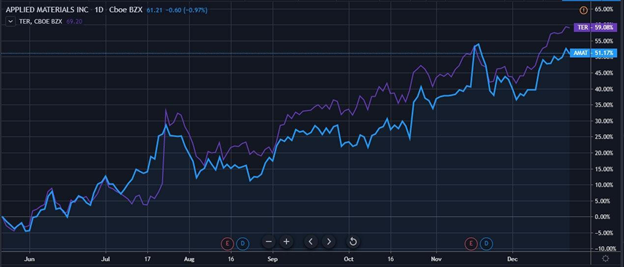
Choosing active assets for pair trading, the trader looks for tools with a historically strong correlation. At a certain moment, a violation of the usual dependence is observed, a discrepancy of the price movement (spread) is formed. Taking into account movement history of active assets, one can suppose that in future the prices should return to the previous dependence. That is why the active asset that has become cheaper is bought, and the active asset that has become more expensive is sold. In pair trading, spreads are traded – instruments discrepancy. It is not so much important here in which direction a particular instrument went, but it is more important that the spread returns to zero. An example of a strong correlation is the shares of the technology sectors AMAT and TER. The companies Applied Materials (AMAT) and Teradune Inc (TER) specialize in the production of semiconductor products, securities are included into NASDAQ index. The market capitalization of AMAT is about five times “heavier” than of TER.
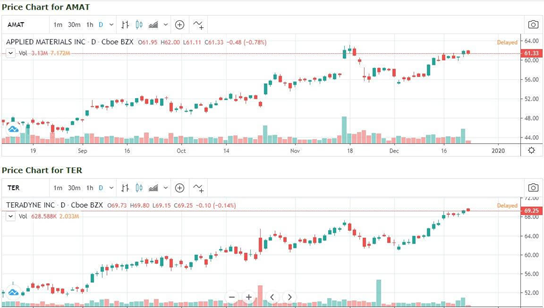
When comparing the charts, you can even visually determine that the active assets are moving synchronously. If you place them on the same chart, then most of the time, they will be almost identical, especially since they are traded in the same price category, the correlation coefficient of 0.97 is a very high degree of correlation. This indicator is suitable for pair trading.
A deal in pair trading is opened with a strong spread extension, when the usual interrelation between active assets is violated.
Trading environment
At some point, share prices began to move in the opposite direction – AMAT went upwards, and TER went down, although until that time the pair was “hand in hand”, their charts moved synchronously. That is why AMAT shares are sold, and TER shares are bought. The deal is closed at the moment, when the charts will converge again. The spread can also be extended in case of unidirectional movement of active assets, then one of them simply grows or falls faster than the other, outpacing the “colleague”. The principle of deal remains the same – an oversold instrument is bought, and an overbought one is sold.
Position calculations
When opening a pair position, active assets parity is maintained with their volatility in mind. If shares are bought and sold, their contribution to the portfolio is calculated with beta coefficients in mind. A simple equation system is used for this.
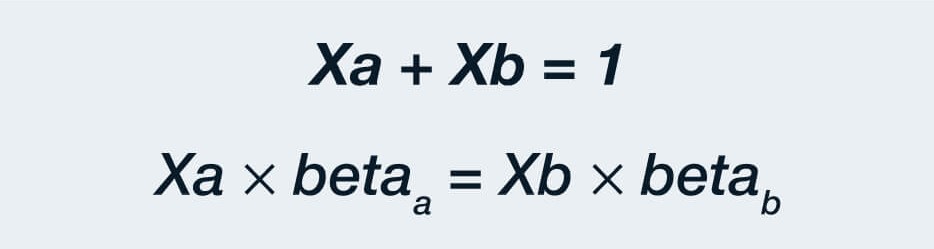
Xa – specific gravity AMAT, Xb- specific gravity TER
In the example with shares AMAT beta coefficient is equal to 1.65, for TER – to 1.56. Substituting the known values into the formula, you can determine the specific weight of each active asset in the pair. In this case, the contribution of AMAT will be 0.48 (48%), of TER – 0.53 (52%). Both active assets are quite volatile and their beta differ not too much.
There may be instruments with a big difference in the pair, in this case, the specific weight of active assets in the pair will also differ significantly. It is necessary to take into account that beta of market active tend to be changed under the influence of various factors. In this case, the specific weight of active assets in the pair is reviewed.
The share of each instrument is calculated based on the cost of the point. When the cost of a single point for both currency pairs is identical, everything is simple – transactions are opened with a single volume. It is true for the pair EURUSD-GBPUSD. But other situations also exist. For example, the cost of a point for the pair EURUSD in a deal with volume of 1 lot is equal to $10, for the pair USDJPY now it is $9.14. To ensure the necessary parity, the volume of the deal for the pair dollar-yen should be 1.09 (10/9, 14) times bigger than the volume of the pair euro-dollar.
The pair trading strategy allows a trader to have a broader view of the market and critically evaluate how diversified his/her portfolio is. Like any other strategy, pair trading cannot guarantee that the deal will follow the planned scenario. Strong correlation between two active assets that has existed for years can be broken in one day by some significant internal phenomenon and will not recover, contrary to expectations. Nevertheless, pair trading is the first step to the comprehension of arbitrage strategies that allow you to make a profit while minimizing risks. Using this strategy, the trader should have a clear algorithm of actions, both on the occasion of a favorable development of the situation, and on the occasion when the situation unfolds according to a negative scenario. Trading according to a well-defined algorithm, strict discipline are important components of successful trading.