
One of the earliest scientific studies of pair trading, which laid the foundation for most of the subsequent works, was published by I. Gatev, V. Goitzman and K. Ruvenhorst. The authors suggested using a remote approach and further back testing, which is actively used in pair trading. The key feature of the author’s approach is the method of determining trading pairs. Asset pairs are identified by calculating the sum of the squares of the differences between the normalized stock prices over a certain period of time. Then the pairs are ranked in descending order, based on the sum of the squares of the differences. The stocks with the smallest differences, i.e. with similar historical price behavior, will have the greatest potential for use in this strategy.
Another approach to the definition of trading pairs, based on the co-integration of assets, is proposed by G.Vidyamurti. The formal definition of cointegration, developed back in 1987, is as follows. A non-stationary time series transformed into a stationary one after n-fold differentiation will be called an integrated one of order n and denoted by I (n). Two integrated time series x and y are cointegrated if there is a linear stationary combination of these series z. That is, there is an α such that z = x-ay ~ I (0). The spread of cointegrated assets remains unchanged over time, which makes such a trading pair suitable for trading.
A significant number of empirical studies are devoted to the effectiveness of statistical arbitration. Thus, B. Du and R. Faff analyze the data of the US stock market for 2003-2008, C. Hoel, using a co-integration approach, shows the effectiveness of the statistical arbitration strategy for the period from 2003 to 2013 on the Norwegian stock market, and G. Miao, based on high-frequency data of the US stock market, claims that the statistical arbitration strategy during 2012 and 2013 was extremely profitable. The effectiveness of pair trading was also studied in the Asian markets (Hong Kong, India, Indonesia, Israel, Japan, Korea, Taiwan, Thailand, the Philippines) for the period from 1991 to 2000, and the method also showed its effectiveness.
Thus, it can be argued that statistical arbitrage is an effective method of modeling the dynamics of financial asset prices, and therefore the study of the applicability of this strategy on the international stock market is in demand and relevant.
Platform and data
To test the statistical arbitrage model described below, a trading platform was chosen on the American stock market NYSE. The futures market is more attractive with low commission costs and theoretically has higher liquidity, which is required for the effective use of this method. The effectiveness of using the method of paired statistical arbitrage was tested on a timeframe of 1 hour, which allowed at the first stages to create a stable model with more significant deviations than with high-frequency trading.
A pair of futures contracts was identified to build the model. AvalonBay Communities Inc (AVB) and UDR Inc (UDR) with similar historical price behavior. Both pairs are traded on the NYSE stock exchange and are characterized by a high correlation (about 85%).
Taking into account the specifics of the industries to which these financial instruments belong, the relationship of prices for futures contracts of companies under various market fluctuations, as well as economic shocks that strongly affect asset prices, is traced. The choice of futures contracts is due to the high liquidity of this financial instrument and low transaction costs. The liquidity of the financial instruments selected for trading is a critical factor when testing any strategy involving short sales.
The hypothesis about the stationarity of the selected data is verified using the cointegration approach. The regression equation of the logarithmic price of the company’s financial instruments is calculated « AVB» from the logarithmic price of the company’s financial instruments « UDR » :
ln(PNK ) = μ + ln(PS ) + εt ,where ln(PNK ) – the logarithmic price of the company’s futures contract «AVB »;
ln (PS ) – the logarithmic price of the company’s futures contract «UDR»;
μ – free member;
εt – regression residuals.
Then the regression residuals are tested for stationarity. The same procedure is carried out with the second pair of assets.
The analysis of the data showed that the absolute values of the spread between the prices of futures contracts of companies are relatively stable for significant periods, there are no sharp structural fluctuations – this means that these assets are co-integrated. In the long term, the spread asymptotically tends to a constant level. However, there are some extreme values in the selected timeframe, and therefore the absolute values of prices have been converted into growth rates.
The developed model
The developed model is based on the growth rates of asset differences:
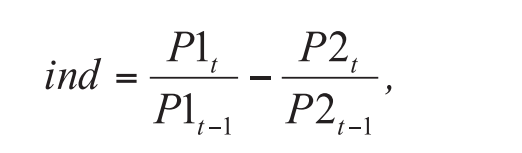
Where ind is an indicator that determines the difference in the growth rates of assets over the past hour; P1t – asset price for the current hour; P1t–1 – the price of the asset for the previous hour. Similarly – for the second asset of the pair.
Thus, the indicator shows how much the price of the first asset is growing or falling relative to the price of the second, i.e. it estimates the spread between assets at the current moment. The average value of the indicator fluctuates around 0, strong deviations in the positive or negative direction show that the first asset is growing in price faster or slower than the second, respectively. These deviations are signals for opening positions.
Conclusion:
The study showed the applicability of paired statistical arbitrage strategies in a developing and rather volatile stock market. When using the developed model, both pairs of selected assets showed a stable increase in income with a clear positive trend. The model turned out to be insensitive to external economic factors, as evidenced by a stable increase in profits over time, without strong losses even in times of crisis. For the wide application of this method on the Russian stock market, it is necessary to increase the liquidity of traded assets, which is clearly not enough at present. In the future, the model will be tested on a demo account, which will allow you to estimate all types of costs in real trading. The Kohonen neural network will also be developed to search for nonlinear relationships of traded assets, which will help to find new potentially more effective pairs for trading by the method of paired statistical arbitrage.